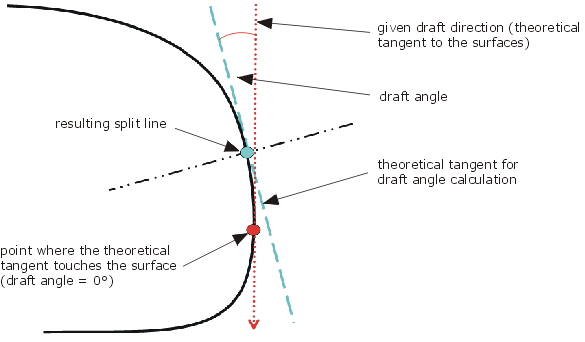
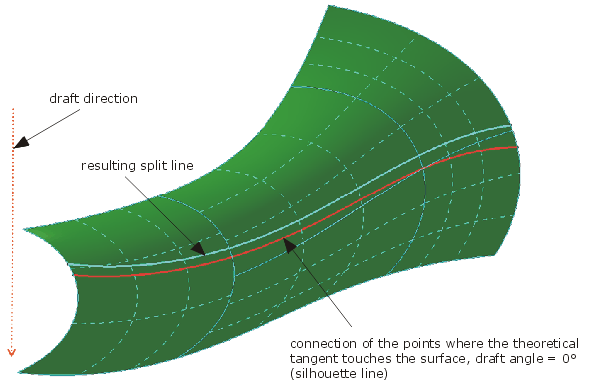
If the draft angle is 0°, the split curve is identical to the silhouette line of the selected surfaces if you are looking in the direction of the light source. The direction of the light source and the tangential planes of the surfaces in the points of the split curve are forming an angle of 0°. The light source is located in this plane.
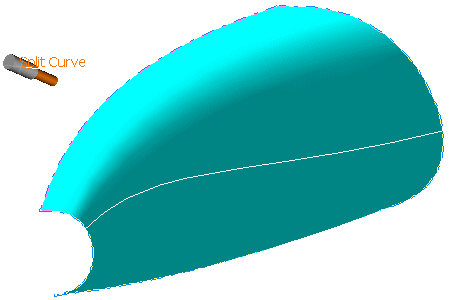
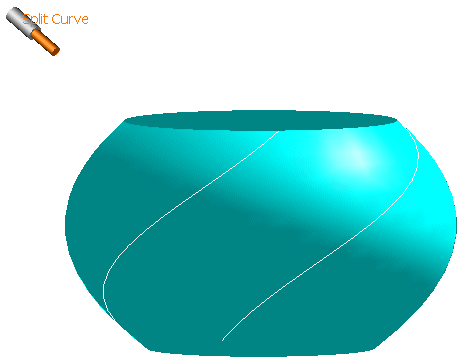
-
Click the Split Curve icon
 .
.
The 'Split Curve' dialog box opens.
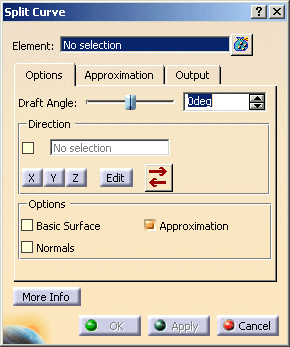
- Elements: Selection of surface elements used for the calculation of the split curve.
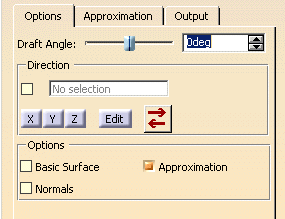
- Draft Angle: Angle between the draft direction and the tangential planes of the surface in the points of the
split curve.
You can define an angle between -90° and 90°.
- Direction: see Defining a direction
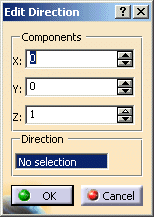
- Components: The components X, Y, Z of the direction vector can be entered directly.
- Direction: The direction vector can be set to a fixed axis.
| Note: The draft direction can also be defined via the contextual command of the light source manipulator. |
- Options
- Basic Surface: This option can be used if the selected elements contain a face.
- OFF: The split curve will only be created on the face.
- ON: The split curve will be created on the underlying surface (basic surface) of the face.
This setting is appropriate if the created curve is longer than the face.
'Basic Surface' OFF 'Basic Surface' ON 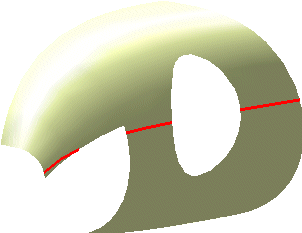
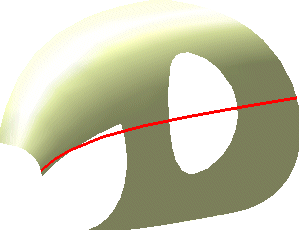
- Normals: The normals of a set of connected surfaces will be adjusted to create a continuous split curve for any draft angle. The reference normal will be determined internally.
- Approximation: Toggle approximation capabilities.
- OFF: The 'Approximation' tab is not available. The result is a 2D curve.
- ON: The 'Approximation' tab is available with all options. The result is a 3D curve.
- Basic Surface: This option can be used if the selected elements contain a face.
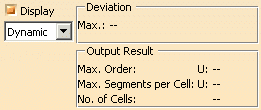
- Display: The graphical display of the deviation values can be globally switched on and off.
- Dynamic, Static, None: See Apply Modes
- Deviation
- Max: Display of the maximum deviation of the actual result from the calculated mathematical result.
- Output Result: See Output Result
![]()