This task explains how to process geometry for a more efficient data management.
If the result does not correspond to the structure (position of cell boundaries) needed for further processing, you can manually move, insert, or delete cell boundaries.
Open the ConversionCurve.CATPart document.
-
Click the Curve Conversion icon
 .
.
The Curve Conversion dialog box opens.
-
Select the element Split.1.
-
Select Single-Result in the Cell Reduction Parameter list on the Output tab.
Manage Cell Boundaries
-
Select Manage Cell Boundaries in the Cell Structure list on the Options tab.
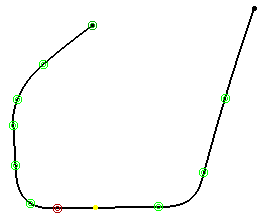
At the input curve boundaries are displayed green manipulators.
-
Move cell boundary: Move a manipulator along the curve between the two adjacent manipulators. After this operation the colors will change.
The original position is displayed in grey color (and can no longer be changed).
The new position is displayed in blue color. The blue manipulator can be moved until the desired position is reached.
-
Delete cell boundary: Right-click a manipulator and select Delete.
The color of the deleted manipulator changes to red.
-
Insert cell boundary: Right-click a manipulator and select Add before or Add after to insert a new cell boundary before or after the current manipulator at the mid point of the next cell.
The new manipulator is displayed in yellow color.
-
Move inserted cell boundary : Move the inserted boundary along the curve until the desired position is reached.
Add/Remove Cell Boundaries
-
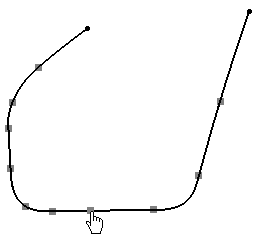
Select Add Cell Boundaries in the Cell Structure list.
The curve is emphasized and cell boundaries are displayed as grey squares.
-
Click the curve.
A cell boundary is added at the selected position.
-
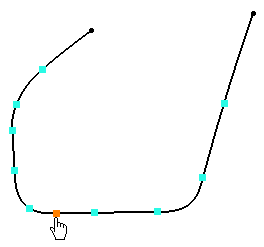
Select Remove Cell Boundaries in the Cell Structure list.
The cell boundaries are displayed as cyan squares.
-
Move the mouse onto the cell boundary to be deleted.
The cell boundary will be displayed in orange.
Clicking the selected cell boundary deletes it.
-
Select again the Manage Cell Boundaries option to display added and removed cell boundaries.
- Element: Specifies the curves to be processed.
- Approximation: Activates or deactivates the Approximation tab. This way, you can e. g. create curves from surface edges without approximation.
Cell Structure:
- Use Input Cell Structure: Each cell of a Domain is approximated separately.
The 'Cell Fusion' options are not available. - Enable Cell Fusion: All adjacent cells of a domain whose transition quality among each other corresponds at least
the 'Continuity' specified, are approximated as one entity (segmentation of the domain in continuity ranges).
The Segmentation is applied to each continuity range.
The transition parameters are used as preferential parameters for further processing with the settings on the Approximation tab. - Manage Cell Boundaries:
Cell boundaries can be moved, inserted, and deleted.
Note: To enable this option the option Single-Result on the 'Output' tab must be selected.
For each input cell boundary a manipulator is displayed.
The manipulator color indicates the current status of the corresponding cell boundary:
green original input cell boundary red deleted input cell boundary blue moved boundary grey original position of a moved boundary yellow inserted boundary
The Cell Fusion options are not available.
Right clicking a manipulator activates contextual commands. - Add Cell Boundaries: Adds cell boundaries to the curve. Existing cell boundaries are displayed as grey squares. To add a new cell boundary, click the wanted boundary position on the curve.
- Remove Cell Boundaries: The cell boundaries are displayed as cyan squares. Moving the mouse over a cell boundary will highlight it in orange. Clicking the highlighted cell boundary deletes it.
- Add / Remove Cell Boundaries: This mode is a combination between the Add Cell Boundaries and the Remove Cell Boundaries mode, i. e. you can add or delete cell boundaries without switching the mode.
Cell Fusion:
The Cell Fusion options are only available if Enable Cell Fusion option is activated.
- Continuity (G3 in ISD only): The cells are only merged if at least the specified continuity is kept.
To keep the number of segments as low as possible in case of using G0 continuity, the tolerance is not considered independently from the specified approximation parameters. - Keep Input Cell Structure: After the approximation operation, the resulting geometry is re-broken at the transitions.
- Display: Depending on the options selected, values are displayed in the graphics area.
- Static, None: See Apply Modes
- Deviation:
- Max.: Shows the maximum deviation between the input element and the resulting output geometry, e. g. between
a guide curve (input) and the resulting surface boundary (output).
Depending on the result you can change parameters and options to improve the resulting geometry.
Note:
If in the Output tab the option Single-multi-segmented-cell (Single B-Spline) is used without the option Max. Deviation, no deviation will be displayed.
- Max.: Shows the maximum deviation between the input element and the resulting output geometry, e. g. between
a guide curve (input) and the resulting surface boundary (output).
- Output Result: See Output Result
Contextual command
- Add before/after: A new cell boundary is added before or after the current boundary in the middle of the selected cell.
- Delete: The selected cell boundary is deleted.
- Reset: Modifications of the current cell boundary are undone:
- Inserted cell boundaries are removed.
- Deleted cell boundaries are restored.
- Moved cell boundaries are reset to their original position.
- Reset all: All modifications of cell boundaries are undone.