See also Layers and Visualization Filters.

-
Select Tools > Visualization Filters.
The Visualization Filters dialog box appears: 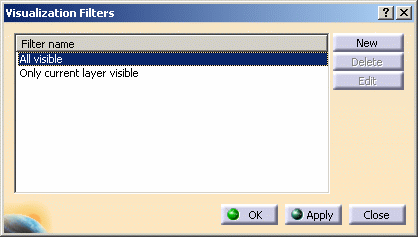
The default current filter All visible is applied automatically: it lets you see all the contents of the document. This filter cannot be deleted. -
Click New.
-
Click in the Criterion box (where you see 0), delete 0 then type 1 so that the filter syntax now looks like this:
Layer = 1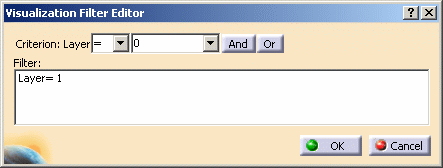
-
Click OK.
This creates a new filter Filter001(with the default filter syntax) in the Visualization Filters dialog box: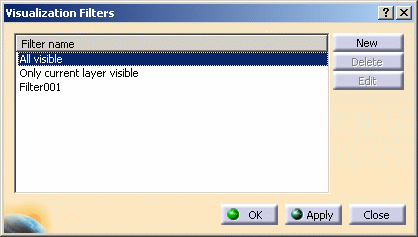
Note that you can customize the filter application. For more information, see Layer Filter. -
Select the root object PadandCylinder in the tree, then select View > Toolbars > GraphicProperties to display the Graphic Properties toolbar.
-
Click the Layer list, then type
0.The root object is now assigned to the layer number 0. -
Select Pad.1 in the tree, click the arrow on the Layer list and check that the Layer list looks like this:
 .
. -
Select Sketch.1 in the tree, click inside the Layer list, then type
1.Sketch.1 is assigned to Layer 1. The Layer list now looks like this:  .
. -
Select Filter001 in the Visualization Filters dialog box and click Apply.
The objects under PadandCylinder are no longer displayed, and the filter remains active. 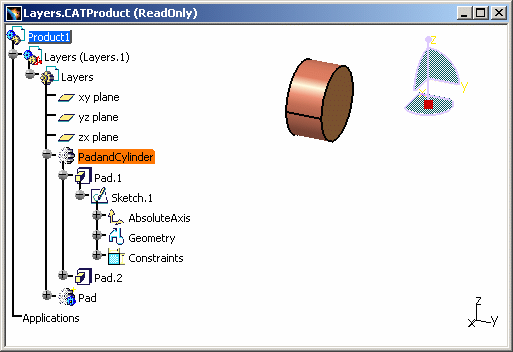 Why are these objects no longer displayed?
All the features below the root object in the tree are considered to be on layer 0 if applying the visualization filter makes the objects invisible. This remains the case even if you assign the objects to layers other than layer 0.
-
This time, select the root object PadandCylinder in the tree, click the Layer list, then type
1to assign it to layer 1.The filter is still active, but this time the object Sketch.1 becomes visible: 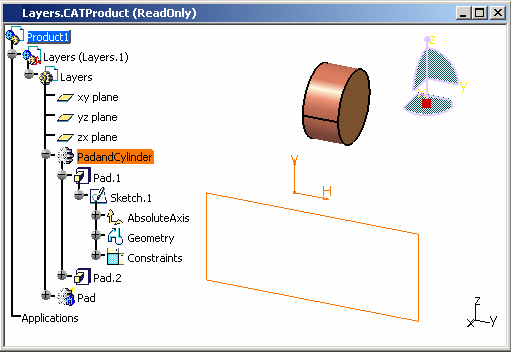 Why is only the Sketch object displayed?
This time applying the visualization filter has the effect of making objects visible, so the Sketch object becomes visible.

To see all the objects again, select the All visible filter then click Apply.
![]()
