Displaying Job Diagnostics
During an analysis, diagnostic information concerning the progress of the analysis is saved in the output database file. The Job Diagnostics tool in shown in Figure 15–1 organizes this information and provides a visual link between the diagnostics and the physical model. Diagnostics can be used to determine the cause of a failed analysis and identify areas of a model that must be revised or redefined.
Diagnostic information is organized according to the steps, increments, and—for contact diagnostics—iterations in an analysis. This organization allows you to determine the stage of the analysis in which warnings, errors, or other problems occur. For more information about the incrementation schemes used by Abaqus, see Defining an analysis in the Abaqus Analysis Guide.
The following information is available from the Job Diagnostics tool:
Summary
The Summary page displays general information about the job, including the job's name, the status of the analysis, the number of increments in each step, and the number of warning and error messages generated by the analysis.
Warnings
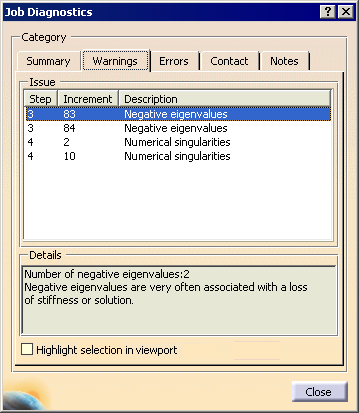
The Warnings page displays issues in the analysis that could potentially lead to undesirable results but do not necessarily cause the analysis to fail. Warnings can be ignored if they are the result of an expected condition or behavior in the model. Warnings from only the last iteration of the last attempt of each increment are displayed. Warnings are available only for jobs involving a Structural Analysis case.
There are three possible warnings:
Numerical singularities: Numerical singularities typically result from rigid body motion, in which a portion of the model offers no resistance to the applied loads. A numerical singularity may indicate the need for additional boundary conditions or constraints in a portion of the model.
Negative eigenvalues: Negative eigenvalues result from a loss of stiffness in the model due to material softening or the sudden buckling of a structure under a load. Negative eigenvalues are common in analyses involving large deformations but may indicate a problem with the model properties in small-deformation analyses.
Zero pivot: Zero pivots generally indicate an overconstraint in the model, typically due to redundant boundary conditions or constraints. An overconstrained node may still behave appropriately, but the presence of redundant constraints could be a modeling problem that leads to undesirable behavior in other portions of the model. A zero pivot also sometimes arises due to rigid body motion.
Errors
The Errors page displays the reason that an analysis aborted or terminated, including the step and increment in which the fatal error occurred.
Contact
The Contact page displays changes in contact status for each iteration in the analysis. A change in contact status involves a node on the slave surface becoming either overclosed (moving into contact with the master surface) or opened (moving out of contact with the master surface). Contact diagnostics are available only for jobs involving a Nonlinear Structural Analysis case.
Notes
For a failed Nonlinear Structural Analysis job, the Notes page displays additional details concerning the error that caused the failure.
For certain warning messages, error messages, and contact diagnostics, you can see which nodes or elements are involved in each diagnostic message using the Highlight selection in viewport option. For warning and error messages, the nodes or elements causing the warning or error are highlighted in the model. For contact diagnostics, the nodes that are overclosing or opening are highlighted in the model.
The Job Diagnostics tool displays information for the most recently attached or imported output database in your Abaqus for CATIA V5 session. The information displayed by the tool is a subset of the diagnostics that appear in the Abaqus data, status, and message files; for details about these files, see Understanding the Files Generated by Analyzing a Model in Abaqus.
This task shows you how to display job diagnostics.
Click the Job Diagnostics icon
 in the Postprocessing toolbar.
The Job Diagnostics dialog box appears with information from the most recently attached or imported output database.
Click the Summary, Warnings, Errors, Contact, and Notes tabs to switch between the various types of diagnostic information, as described above.
To highlight the nodes or elements associated with a particular warning, error, or contact status message, click on the message in the Issue table, and toggle on Highlight selection in viewport.
When you are done reviewing diagnostic information, click Close to close the Job Diagnostics dialog box.