You generate contour lines by cutting the mesh or the surface by planes that are all perpendicular to the Z-axis. Those planes can be of two types: major planes or minor planes.
The result Contour Map contains contour lines that are in fact
V5 scans.
According to the Smoothing option selected, the contour lines
look like scans (No smoothing), or like curves (Light
to Strong smoothing).
Several contour lines can be found on a single cutting plane.
Those scans can be displayed as major or minor contour lines, or extracted
into two SetOfScans, one containing the major scans, the other containing
the minor scans (see the
contextual menu).
Each contour line can have one or several annotations, indicating the
height of the corresponding cutting plane.
Annotations can also be found on isolated points (peaks) that represent
lowest and highest points.
The Contour Map feature is used to generate a 2D drawing: all the scans and annotations are automatically extracted and sent to the drawing with attributes for the color, font, etc.
-
Click Contour Map
 .
.
The Contour Map dialog box opens at the Input tab:
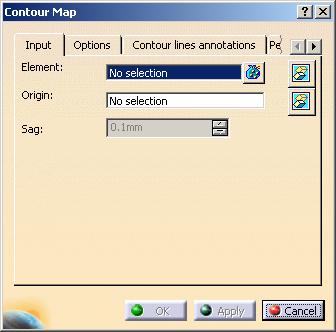
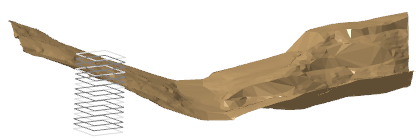
A series of cutting planes is displayed, with default parameters.
-
Still in the Input tab:
- Select Mesh.2 as the
Element to
be cut by the planes.
Multi-selection is available.
You can select several meshes, or surfaces and meshes or a geometrical set. - Define the origin of the planes.
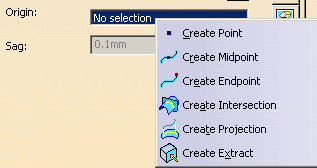
Place the cursor on the Origin field and :- Select an existing point.
- Or create one with the contextual menu.
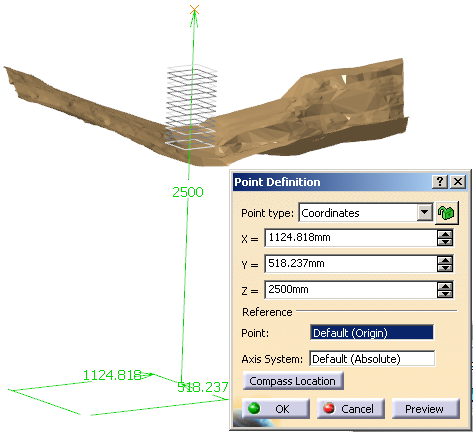
- The map plane is automatically defined by this point and the
Z-Axis.
- If required, click
 to hide or show the
Element and the Origin.
to hide or show the
Element and the Origin. - If you have selected surfaces or volumes, you can define the Sag (chordal error) used to tessellate them.
- Select Mesh.2 as the
Element to
be cut by the planes.
-
Go to the Options tab to define the planes and contour lines.
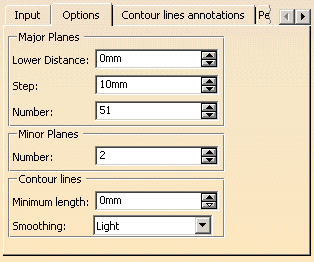
For the Major Planes: - Key in the
Lower Distance,
i.e. the distance on the Z-Axis between the first (lower) plane and
the origin point.
By default, this lower distance is automatically computed to the lower limit of the input elements (first plane with intersection with the input elements). - Key in the Step between two major planes.
- Key in the
Number of major planes requested.
By default, this number is automatically computed to the upper limit of the input elements (first plane without intersection with the input elements).
For the Minor Planes:
- Key in the Number of minor planes you need between two major planes.
The display of the cutting planes is updated automatically.
For the Contour lines:
- Key in the Minimum length under which a contour line is not created.
- Select the
Smoothing type of contour lines:
- No (there is no smoothing)
- Light
- Medium
- Strong.
- Key in the
Lower Distance,
i.e. the distance on the Z-Axis between the first (lower) plane and
the origin point.
-
Go to the Contours lines annotations tab to define their font options, spacing and location.
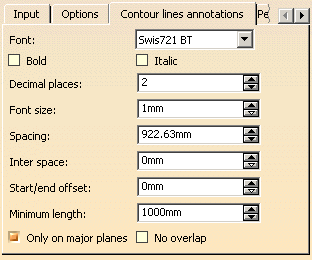
In addition to the font options: - Spacing defines the minimum length between two consecutive annotations lying on a same contour line.
- Inter space defines the minimum length between two annotations lying on two different contour lines.
- Start/end offset defines the minimum length between the start and end points of a contour line and any annotation.
- Minimum length defines the minimum length of a contour line under which no annotation is created.
By default, Only on major planes is selected, preventing the creation of annotations on contour lines resulting from minor planes. Clear this check box if you want to create annotations on contour lines resulting from minor planes too.
By default, No overlap is not selected: Overlaps between annotations are not allowed, but overlaps of annotations with contour lines resulting from minor planes are allowed.
Select the No overlap check box to prevent the overlaps of any annotation with other annotations and with contour lines.
-
Go to the Peak annotations tab to define their font options and location.
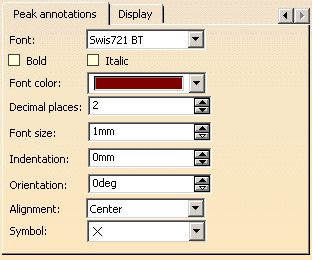
In addition to the font options, - Indentation defines an indent offset between the text anchor point and the peak location symbol.
- Symbol lets you select a peak location symbol from the list.
-
Go to the Display tab to define the display options.
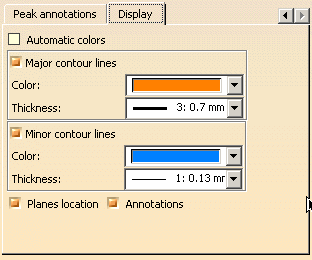
By default: - The
Automatic colors check box is not selected.
When you select it:
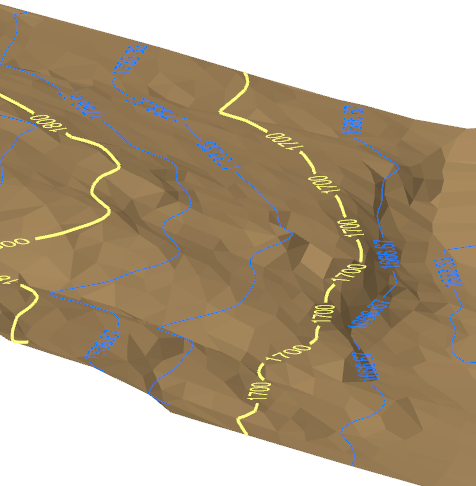
- Contour lines are colored from blue at the minimum Z to
red at the maximum Z with a continuous range of intermediate
colors.
- The Color lists under Major contour lines and Minor contour lines are no longer available.
- You can select a line Thickness under Major contour lines and Minor contour lines.
- Contour lines are colored from blue at the minimum Z to
red at the maximum Z with a continuous range of intermediate
colors.
- The following check boxes are selected:
- Major contour lines, and the contour lines created from the major planes are displayed. You can edit their Color (provided Automatic colors is not selected) and Thickness.
- Minor contour lines, and the contour lines created from the minor planes are displayed. You can edit their Color (provided Automatic colors is not selected) and Thickness.
- Planes Location, and the planes that define the contour lines are displayed
- Annotations, and contour lines annotations are displayed.
- The
Automatic colors check box is not selected.
When you select it:
-
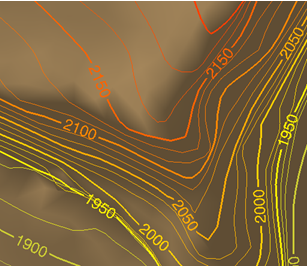
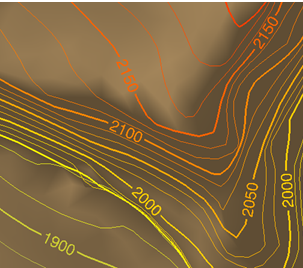
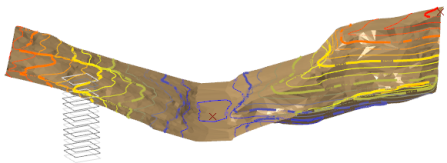
Click Apply.
The contour lines are computed and displayed:
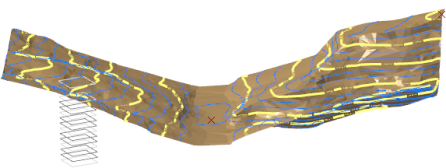
With the mesh hidden:
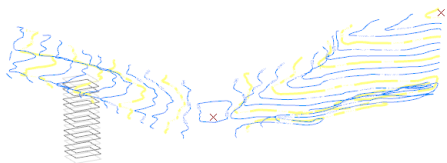
Closer look:
-
Click OK to validate and exit the dialog box.
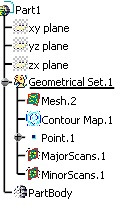
A Contour Map feature is created in the specification tree.
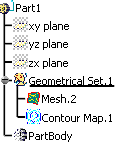
You can:- Double-click it to edit it, e.g. to replace the input mesh by another one.
- Right-click it to display its
contextual menu.
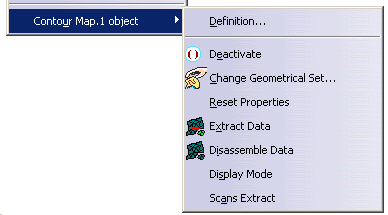
- Definition reopens the Contour Map dialog box (equivalent to double-click).
- Display Mode opens the Contour Map Display Mode
dialog box.
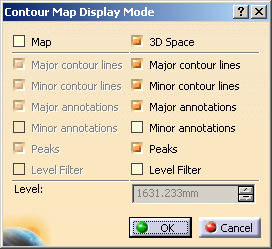
By default, 3D Space is selected.
Major Scans displays only the major scans.
Minor Scans displays only the minor scans.
Level Filter displays only the scan of a given Level. It requires that you enter this level in the field below. - Scans
Extract creates automatically two sets of scans: one for
the major scans, one for the minor scans.
![]()