Generating Simulation Reports

This procedure describes how to generate simulation reports. Simulation reporting is based on XML, and therefore users may customize their reports.  Users can generate two reports in html:
To perform this procedure, you should have selected the parameters for the report and run a simulation.
  1. Click Resource Reports - Bar Charts and select (from the PPR tree or the geometry) a resource selected in the Statistics dialog box.

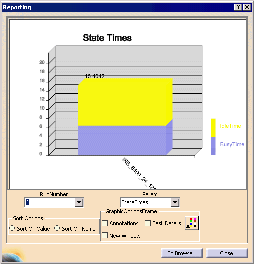
    The Reporting dialog box appears for the resource.
    Click to enlarge this image.
    If you have run the simulation more than once, you can use the list under RunNumber to select the version of the simulation for which you want data.  You can also select from among different parameters using the list under Param
      Selecting the To Browser button puts the bar graph in a browser instead of within the Reporting dialog box.
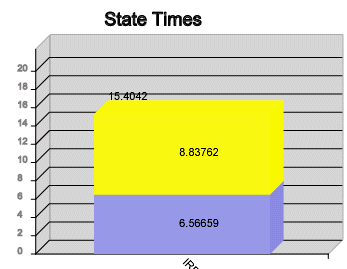
      Selecting the Annotations option adds data to the graph.
     
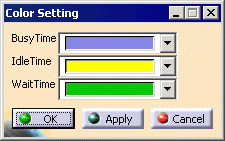
      Selecting the Color Setting button enables you to alter the color settings.  The default settings are:
     
      Selecting a different resource while the dialog box is open gives you the bar chart associated with the selected resource.  It is not necessary to select the Close button, and then reopen the Reporting dialog box after selecting a different resource.
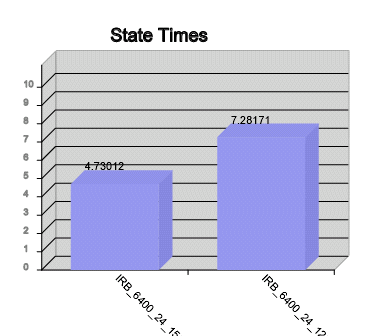
      To see charts showing data from multiple resources, select multiple resources (using the Ctrl key) before selecting the command.  You can sort the data by name or by value.
     
      To compare one run with another, select the New Window option, then a run, and then select a different run.
  2. Select the Close button.

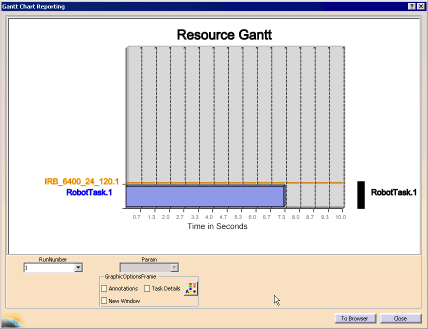
  3. Click Resource Reports - Gantt Chart

    The Gantt Chart Reporting dialog box appears for the resource.
    Click to enlarge this image.
    Selecting the Task Details option provides visualization about the types of activities within the simulation (in the image below, the default Delay option has been changed to magenta so that it is easier to see).
     
      A customizable javascript enables a pop-up window with extra data:
     
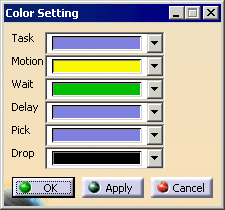
      The Color Setting button controls the colors of the visualization.  The defaults are:
     
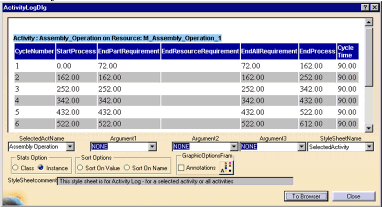
  4. Click Customized Reporting.

    The  Customized Reporting dialog box appears.  Four style sheets are included for customized reporting; users can add others by using the Tools > Options > Release Simulation > Graphic Reporting tab.
    Below  is an XSLT style-sheet-based HTML report.  You can plug in your own style sheet (click on the image to view full size):
    Click to enlarge this image.
  5. When you are finished selecting reports, select the Close button.