This task shows you how to analyze the curvature of curves, or surface boundaries and view the quick analysis on the curve.
This command is only available with:
-
FreeStyle Shaper
-
Generative Shape Design 2
-
Wireframe and Surface for Building 1
-
Sketcher
Open the FreeStyle_10.CATPart document.
- If you select the surface, the analysis is performed on all its
boundaries.
- If you select a specific boundary, the analysis is performed only on
this selected boundary.
Make sure the Geometrical Element Filter selection mode is active from the User Selection Filter toolbar. This mode lets you select sub- elements.
-
Select the curve.
-
The Porcupine Curvature dialog box appears.
-
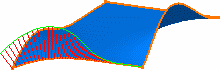
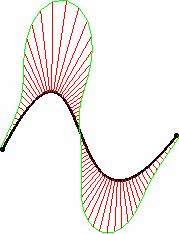
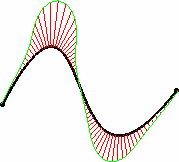
Automatically the curvature comb is displayed on the selected curve:
-
Select the Project On Plane check box to analyze the projected curve in the selected plane referenced by the compass.
-
If you clear the Project On Plane check box, the analysis is performed according to the curve orientation.
This is the default option.
-
Use the spinners to adjust the number of spikes and modify the density.
-
You can also halve the number of spikes in the comb clicking the / 2 button as many times as required.
This option is particularly useful when the geometry is too dense to be read but the resulting curve may not be smooth enough for your analysis needs.
You could just as well double the number of spikes using the X2 button.
-
Similarly, click the / 2 button to fine-tune the amplitude (size) of the spikes, and re-compute the analysis curve accordingly.
-
Optional: Select one of the following check boxes to assign the zoom factors automatically or manually:
- Select the Automatic check box to optimize the spikes length so that even when zooming in or out, the spikes are always visible.
- Select the Variable Auto check box to apply an individual zoom factor to each selected curve.
-
Select the Logarithm, Min Value, and Max Value options to display the logarithmic values in the 3D geometry.
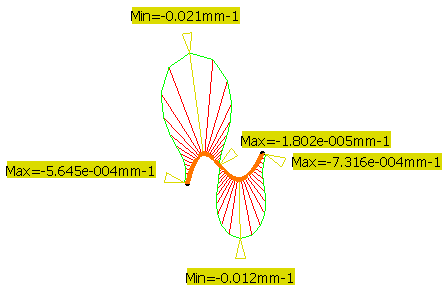
Displaying these values does not modify the analysis.
-
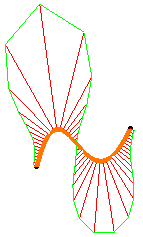
Select Reverse, you will get something like this:
That is the analysis opposite to what was initially displayed. This is useful when from the current viewpoint, you do not know how the curve is oriented.
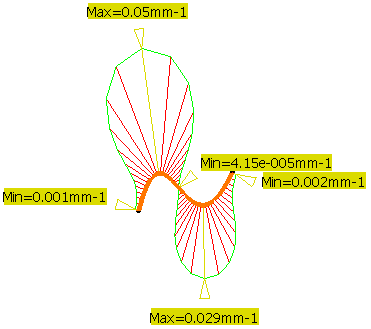
- Inflection points are displayed only if the Project On Plane check box, Min Value and Max Value options are selected.
- The Inverse Value option displays the inverse value in Radius when the Curvature option is selected, or in Curvature when the Radius option is selected. This option does not recalculate Max and Min type values, it displays only the inverse values and Max and Min location for the selected type are still displayed.
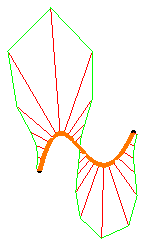
- You can right-click on any of the spikes and select Keep
this Point to keep the current point at this location.
A Point.xxx appears in the specification tree.
If you select the both, the Min Value and Max Value options under the Display Options area, you have the following options:
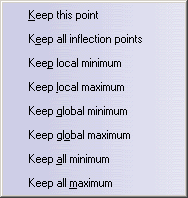
- If you select the Min Value and right-click any of the spikes, the commands suffixed with minimum and Keep this point appear in the context menu.
- If you select the Max Value and right-click any of the spikes, the commands suffixed with maximum and Keep this point appear in the context menu.
- Take care that all these contextual commands are applicable not
only to the curve where you have right-clicked the spike but to all
the curves involved in the analyses.
- Keep all inflection points: Keeps all the inflection points.
- Keep local minimum: Keeps all the points corresponding to all the minima except the minimal minimum.
- Keep local maximum: Keeps all the points corresponding to all the maxima except the maximal maximum.
- Keep global minimum: Keeps only the point corresponding to the minimal minimum.
- Keep global maximum: Keeps only the point corresponding to the maximal maximum.
- Keep all minimum: Keeps all the points corresponding to all the minima.
- Keep all maximum: Keeps all the points corresponding to all the maxima.
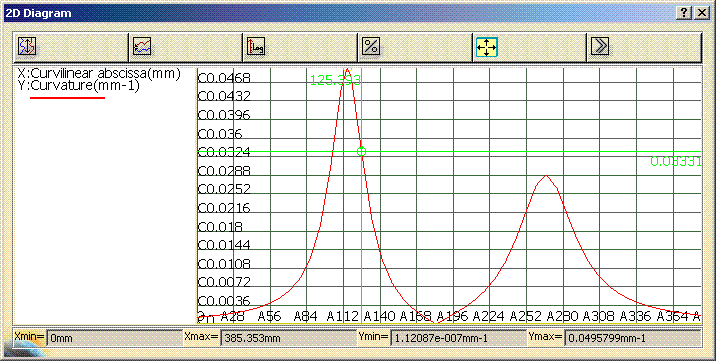
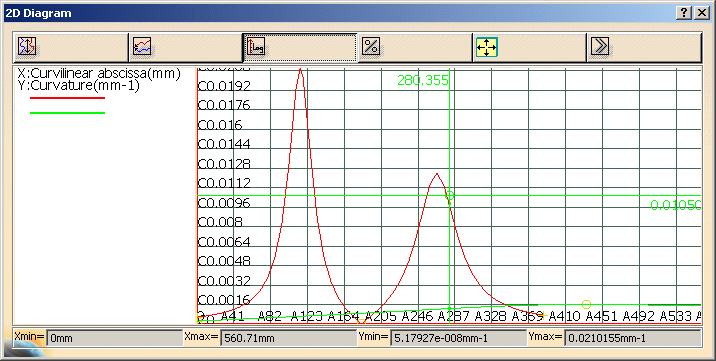
- In the curvature graph, X axis abscissa is curvilinear when
Curvilinear is enabled in the Porcupine Curvature
dialog box, otherwise X axis abscissa is parametric.
When X axis abscissa is parametric, its range is not necessary between 0 and 1. - X axis abscissa values are independent from the selected type of curvature analysis, Radius or Curvature.
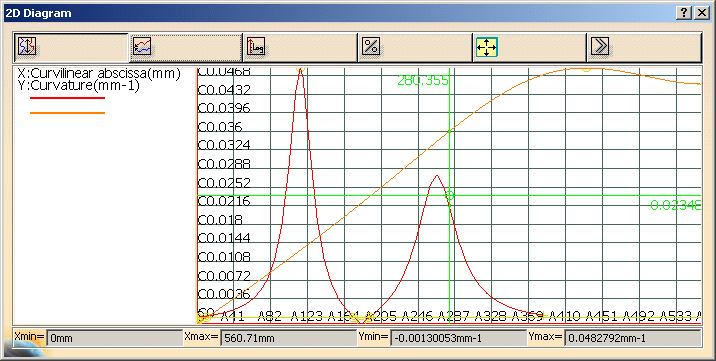
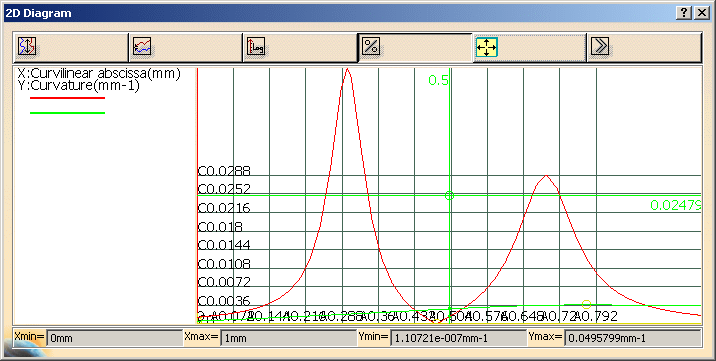
The curvature amplitude and parameter of the analyzed curve is represented in this diagram.
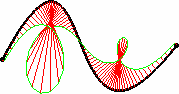
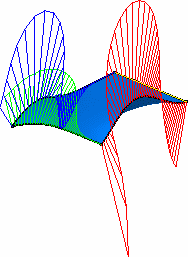
When analyzing a surface or several curves, i.e. when there are several curvature analyses on elements that are not necessarily of the same size for example, you can use different options to view the analyses.
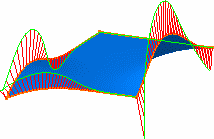
For example, when analyzing a surface, by default you obtain this diagram, where the curves color match the ones on the geometry.
-
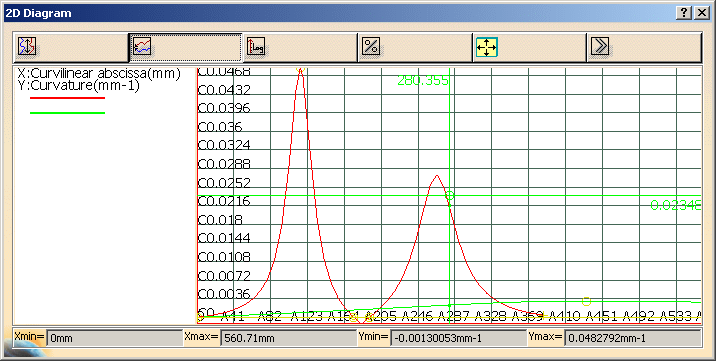
Move the cursor on 3D curve. You can see that the position of 2D cursor in the graph of 2D Diagram dialog box is updated. Similarly if you move the 2D cursor in the dialog box, the position in 3D comb is updated accordingly.
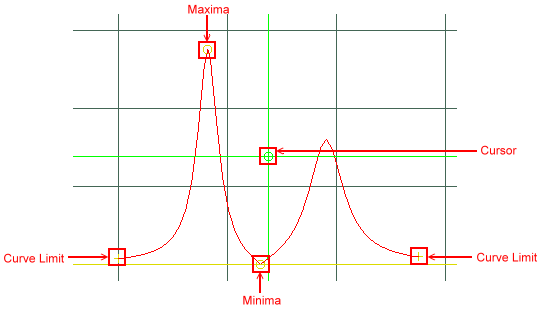
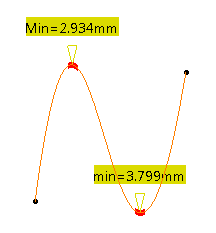
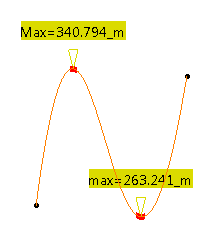
On selecting the both Max Value and Min Value in the Porcupine Curvature dialog box, Maxima, Minima, inflections and curve limits are seen in 3D area and also in the 2D Diagram dialog box. The 2D curve has different symbols to identify these important points on it:- Maxima and Minima are represented with unfilled circles.
- Inflections are represented by two concentric unfilled circles.
- Curve limits are represented by plus signs.
-
All curves with the same vertical length
 :
All the curves are displayed to the same vertical length, regardless of
the scale.
:
All the curves are displayed to the same vertical length, regardless of
the scale.
-
All curves with the same origin
 :
All the curves are displayed to a common origin point on the amplitude
scale.
:
All the curves are displayed to a common origin point on the amplitude
scale.
-
Use a logarithm scale on vertical axis
 :
All curves are displayed to a logarithm scale for the amplitude, and a
linear scale for the X axis.
:
All curves are displayed to a logarithm scale for the amplitude, and a
linear scale for the X axis.
-
Display percentage instead of length for horizontal axis
 :
The abscissa is displayed as percentage of the amplitude of X parameters
(parametric mode) or the length of the 3D curve (curvilinear mode).
:
The abscissa is displayed as percentage of the amplitude of X parameters
(parametric mode) or the length of the 3D curve (curvilinear mode).
-
Reframe the diagram
 :
Reframes the diagram within the viewer window, as you may move and zoom
it within the window.
:
Reframes the diagram within the viewer window, as you may move and zoom
it within the window. -
Display a panel with more options
 :
Displays the Diagram Options dialog box that enables you to
define more options.
:
Displays the Diagram Options dialog box that enables you to
define more options.
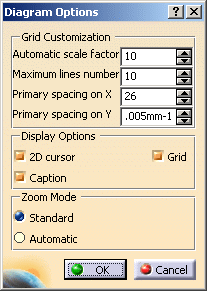
- Grid
Customization: The
number of lines
displayed on grid during
zoom depends on the
following options:
- Automatic scale factor: Defines the space between two coordinate lines when when there are not enough lines in the viewer.
- Maximum lines number: Defines the maximum number of lines displayed in the viewer without zooming.
- Primary spacing on X: Defines the distance between the coordinates of the X-axis.
- Primary spacing on Y: Defines the distance between the coordinates of the Y-axis.
- Display Options:
The display in the 2D
Diagram can be
customized:
- 2D cursor: Select this option to display the 2D cursor.
- Caption: Select this option to display the caption area.
- Grid: Select this option to display the grid.
- Zoom Mode:
There are two ways to
zoom in the viewer
window.
- By using the mouse you can navigate in the viewer graph by panning (translation) and zooming in it.
- You can define a frame in the area where to zoom in. The graphical area is selected by using trap selection with the mouse. For zoom by trap two types of stretching are available:
- Standard: There is no stretching. The area is zoomed in the window and the X-axis and Y-axis intervals depend on the values defined in Primary spacing on X and Primary spacing on Y.
- Automatic: The horizontal X-axis interval corresponds to the interval resulting from zoom. The vertical Y-axis interval corresponds to the extrema computed from the Xmin and Xmax of the X-axis interval.
- Grid
Customization: The
number of lines
displayed on grid during
zoom depends on the
following options:
Depending on the chosen option,
values displayed in the diagram are updated.
The following values are displayed for all the analyzed curves in
2D Diagram dialog box:
- Xmin: The minimum abscissa of all the curves in the graphical area.
- Xmax: The maximum abscissa of all the curves in the graphical area.
- Ymin: The minimum ordinate of all the curves in the graphical area.
- Ymax: The maximum ordinate of all the curves in the graphical area.
-
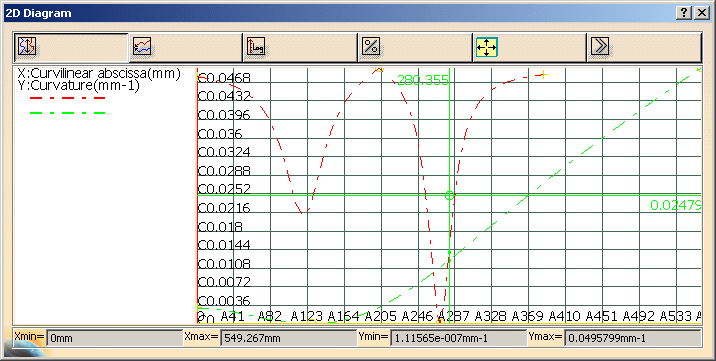
Right-click in the viewer window and choose one of the following options from the contextual menu:
- Reframe
- Inverse All X: Inverts the curve according to the X-axis. The inverted curve is displayed as a dashed line.
- Inverse All Y: Inverts the curve according to the Y-axis. The inverted curve is displayed as a dashed line.
- Same vertical length
- Same origin
- Log. scale
- Display percentage
These options have same function as mentioned above for the buttons.
The 2D Diagram with the Inverse All X and Inverse All Y selected is as seen:
-
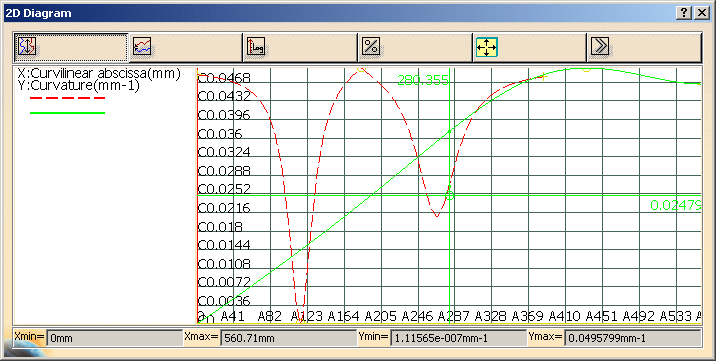
Right-click a curve and choose one of the following options from the contextual menu:
- Drop marker: Creates a geometric 3D point corresponding to the position of the 2D cursor on the curve. Adds Points.xxx in the specification tree.
- Inverse X-coord: Inverts the curve according to the X-axis.
- Inverse Y-coord: Inverts the curve
according to the Y-axis.
The 2D Diagram with the Inverse Y-coord option selected is as seen:
-
The caption area displays the list of the 2D curves and the X and Y axis plotting. Each 2D curve is symbolized by a line with the same color in the caption area. In case of inverted dashed line, the caption 2D line representation is a dashed line.
Right-click the line in the caption area and choose one of the following options from the contextual menu:- Hide/Show: Hides or shows the curve in the viewer window.
- Change Color: Changes the color of the 2D curve in the Color editor.
- Colors From Model: Imposes the color of the analyzed entity (3D curve or surface) to the selected 2D curve.
- Colors From Model All Curves: Imposes the color of the analyzed entity (3D curve or surface) to the all corresponding 2D curves.
- Inverse X-coord: Inverts the curve according to the X-axis.
- Inverse Y-coord: Inverts the curve according to the Y-axis.

Users color's for curve are lost when you close the curvature graph dialog box.
-
Slide the pointer over the diagram to display the amplitude at a given point of the curve.
You can slide the pointer over the diagram and the 3D analysis.
Click the X in the top right corner to close the diagram.
-
Click OK in the Porcupine Curvature dialog box once you are satisfied with the performed analysis.
The analysis (identified as Curvature Analysis.x) is added to the specification tree.
In case of clipping, you may want to temporarily modify the Depth Effects' Far and Near Limits. See Setting Depth Effects in Infrastructure User Guide.
-
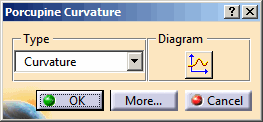
Click Porcupine Curvature Analysis
 in the Shape Analysis toolbar.
The Porcupine Curvature dialog box appears.
-
Click the More... button in the Porcupine Curvature dialog box.
The Porcupine Curvature dialog box appears with more options.
-
From the Type list, select Radius.
-
Select the Quick tab.
-
In the Radius box, type the value or use the arrows to change the value.
-
Select a curve in the work area.
The parts of the curve having radius value less than the specified tolerance value are displayed in red color.
- You can click the color bar available before the Radius box to configure the color.
- In the Quick tab, when you select Radius from the Type list, the Max Value option is disabled.
-
In the Type area, select Curvature.
The parts of the curve having curvature more than the specified tolerance value are displayed in red color.
In the Quick tab, when you select Curvature from the Type list, the Min Value option is disabled.