Checking Connections between Curves' Extremities
Open the FreeStyle_09.CATPart document.
-
Click Connect Checker Analysis
 in the Shape Analysis toolbar.
 -
Select both curves to be analyzed.
-
Click the Curve-Curve Connection icon
 in the Connect Checker dialog box.
A text is displayed on the geometry, indicating the value of the connection deviation.
-
Select either of the options: G0, G1, G2, G3, or Overlap.
You can choose the type of analysis to be performed using the combo: G0, G1, G2, G3, or Overlap. -
Set Min/Max value: In case of G2 analysis, if the concavity option is active a white circle enables to indicate whether there is a concavity defect between the curves.
Concavity Defect: In case of G2 analysis, if the concavity option is active, a computation of angle between the two osculator planes enables to evaluate the concavity defect. This information is available only in full analysis mode. The angle value is displayed only when it is greater than 0.01 degrees in a white tag. Moreover a white circle enables to locate the defect.
-
Click the Quick display mode
 button.
The dialog box changes along with the text on the geometry.
With our example, the text in the geometry disappears because the distance between the two curves is smaller than the set Distance value.
-
Check the G1 button:
A text is displayed on a green background (as defined by default for the G1 criterion) to indicate that the G1 criterion is not respected, because the first text displayed is the one for which the set tolerance is not complied with. You can then increase the Tangency value, or modify the geometry to comply with your needs.
-
Similarly, if you check the G2 value, the displayed text indicates that the curvature between the two analyzed curves is greater than the set value.
-
Modify the tolerance values, or the geometry to comply with the tolerances.
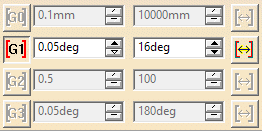
For example, if you modify the G1 value to set it to 16 degrees, the geometry instantly reflects the compliance with the new value.
Under the Display filter area, use the spinners to define the deviation tolerance limits.
You can clickbutton to automatically fill the minimum and maximum values. You can specify a color for displayed tag and symbol by clicking on the color icon available before each row.
The maximum deviation values on the current geometry are displayed at the bottom of the dialog box.
-
Click OK to create the analysis.
The analysis (identified as Connect Checker Analysis.x) is added to the specification tree.
This allows the automatic update of the analysis when you modify any of the curves.
-
If you do not wish to create the analysis, simply click Cancel.
Double-click the Connect Checker Analysis from the specification tree to edit it.
- You can analyze internal edges of a element, such as a Join for example, by selecting only one of the initial elements:
- Use the Overlap Defect
mode to highlight where, on the common boundary, the two curves overlap. In Full Analysis mode, a text is displayed indicating whether the curves overlap. In Quick Analysis mode, you can set color to the overlap using the color chooser.
Checking Connections Between Curve's Extremity and Its Projection on a Curve
Open the FSS_CCK_Curve_Curve01.CATPart document.
-
Click Connect Checker
Analysis
.
- Select both curves to be analyzed.
-
Click
Curve-Curve Connection
in the dialog box and
Projection
option in the Connect
Checker
analysis dashboard.
The Connect Checker dialog box is displayed.
- Set the Maximum gap for the connection analysis. The Connect Checker measures the gap of every connection between each of the borders of each of the geometrical elements, irrespective of the size of the elements.
- If the value of the gap is less than Maximum Gap, the connection is analyzed.
- If the
value of the gap is outside of this limit, the connection is not
analyzed.
There may be instances (such as very small elements, or very large Maximum Gap) where the system finds connections which are unexpected. In these instances, adjust the value of Maximum Gap until the unexpected connections are eliminated. -
Select either of the options: G0, G1, G2, or G3. You can choose the type of analysis to be performed using the combination: G0, G1, G2, or G3. The Overlap option is not available in Projection for the Curve-Curve option.
-
Check the analysis results on the geometry. The subsequent sections show the result of connecting two curves with a combination between G0, G1, G2 or G3 and Projection.
G0 Continuity
G1 Continuity
For G1 analysis, the displayed angular value (in degrees) is the angle
between the two tangents of the curves at the extremity. The displayed
angle value does not depend on the orientation of the curves.
In the example, the G1 angle is the angle between tangents T1 and T2
internally computed.
G2 Continuity
G2 Continuity