|
This task shows how to analyze the mapping
curvature of a surface. |
 |
- Surfacic curvature analyses can be performed on a set of surfaces.
- If an element belongs to an analysis, it cannot be selected
simultaneously for another analysis, you need to remove the current
analysis by deselecting the element to be able to use it again.
- In some cases, even though the rendering style is properly set, it
may happen that the analysis results are not visible. Check that the
geometry is up-to-date, or perform an update on the involved geometric
elements.
- The analysis results depend of the current object. If you want to
change the scope of analysis, use the Define in Work object
contextual command.
- The different mapping analyses of the same surfaces cannot be
displayed simultaneously, even if you have set the mapping analyzes in no
show. You need to visualize them one after the other.
|
 |
This command is only available
with:
|
 |
Open the
FreeStyle_02.CATPart document:
- The discretization option should be set to a maximum (in
Infrastructure User's Guide, see Performance: the 3D Accuracy >
Fixed option should be set to 0.01 and the Curves' accuracy
ratio option should be set to 0.10s). The accuracy of the analysis
depends on the tessellation values.
- When the 3D Accuracy parameter does not give enough
visualization tessellation triangles, case of flat surfaces for example,
it is advised to select Enable isoparametrics generation
option with a few isoparametrics. For more information, see
Infrastructure User's Guide: Customizing: Customizing Settings: General:
Display: Performance.
The generated isoparametrics are taken as a base line for the
visualization tessellation mesh and therefore have an influence on the
surfacic curvature computation results.
- Due to the technology used
(called texture mapping) and the hardware capabilities on which CATIA is
running, the analysis accuracy may be incorrect. In this case you should
use the On the Fly option that is independent of
visualization technology and better results than the other Display Options..
- Clear the Highlight faces and edges option in Tools
> Options > General > Display > Navigation to disable the
highlight of the geometry selection.
- If the No warning message if material mode is not ON
option is selected in Tools > Options > Shape > FreeStyle
>
General tab, Mapping Analysis option
area, it allows you to set the
material mode to ON automatically.
This option sets the material mode to ON even if the
Materials
option in the
View > Render
Style > Customize View command is cleared. No warning message is
displayed asking you to change the material mode. The material is
automatically seen for analysis. After completion of the analysis, the
material mode returns to its initial state.
- If
No warning message if material mode is not ON option is cleared, the warning message is displayed asking you to set
the Materials mode to ON. The material mode is not automatically
set and not seen during analysis.
- You can now perform an analysis On the Fly
even if the Material option is not checked, see
On the Fly option.
|
 |
-
Select Surface.1.
-
Click Surfacic Curvature Analysis
 in the
Shape Analysis toolbar (Draft sub-toolbar).
in the
Shape Analysis toolbar (Draft sub-toolbar).
The Surfacic curvature dialog box is
displayed, and the analysis is visible on the selected element.
The Surfacic Curvature Analysis.1
is created in the specification tree under the Free Form Analysis.1.
|
|
|
Options in Surfacic Curvature Dialog Box
|
|
|
The Surfacic curvature dialog box
displays the following information:
-
Type analysis option allows you to
make the following analyses:
-
Gaussian : (Minimum Curvature) *
(Maximum Curvature)
 |
Unit for Gaussian is 1/(mm^2). |
-
Square root Gaussian = SquareRoot
of the Gaussian
|
|
Unit for Square root Gaussian is 1/(mm^1). |
-
Minimum : Curvature along the
direction of minimal curvature
-
Maximum : Curvature along the
direction of maximal curvature
-
Mean : (Minimum curvature +
Maximum curvature) / 2
-
Limited : User-defined radius
limits
-
Inflection Area : Identifies the
curvature orientation
-
Color Scale Options
-
Hide/ Show color scale option
allows you to display the Surfacic Curvature Analysis.n
(n= 1,
2, 3, etc) dialog box associated with the current
analysis.
-
Color Scale Size
option allows you to view the list of colors in the
Surfacic Curvature Ananlysis.n (n=1,2,3, etc) dialog
box.
-
Reset colors
option allows you to reset the colors of the color scale.
-
Inverse colors
option allows you to inverse the colors of the color scale.
-
Sharp mode
option allows to switch from the Gradient mode
(default mode)to view the sharp interpolation of colors on the curvature
of the surface.
-
On the Fly
option allows you to make a local analysis:
-
The On the fly analysis can be
performed on the elements, selected or not, of the current part only.
It is not available with the Inflection Area analysis
type.
-
The curvature and radius values are
displayed at the cursor location (for Gaussian analysis, only the
square root of Gaussian curvature value is displayed), as well as the minimum and maximum curvature
values and the minimum and maximum curvature directions. As you move
the pointer over the surface, the display is dynamically updated.
-
The displayed values may vary from the
information displayed as the Use Max/Use Min
values, as it is the precise value at a given point (where the
pointer is) and does not depend on the set discretization.
-
You cannot snap on point when performing
an On the Fly analysis.
-
Click a location
and right-click the On the Fly curvature/radius label to
display the contextual commands.
These commands are not available in P1 mode:
-
Show Min/Max option allows you to
locate the minimum and maximum values for the selected analysis type,
except for Inflection Area analysis type.
-
No Highlight option allows
you to disable the Highlight faces and edges option in
Tools
> Options > General > Display > Navigation which highlight of the geometry selection.
-
Positive only option allows you
to get analysis values as positive values, available with Gaussian,
Minimum and Maximum analysis types only.
-
Radius Mode option allows you to
get analysis values as radius values, available with Minimum
and Maximum analysis types only.
|
|
|
Color Scale Options in Surfacic Curvature Analysis Dialog Box
|
|
|
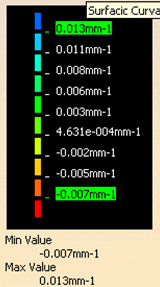
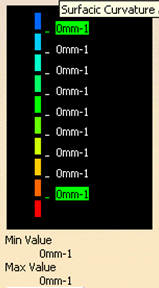
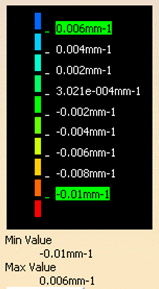
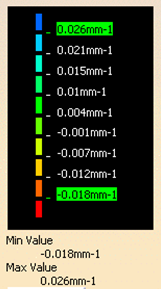
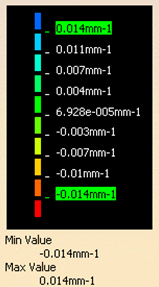
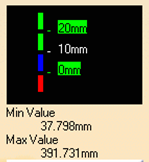
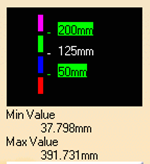
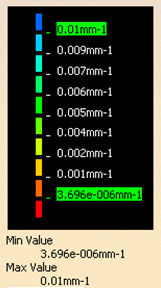
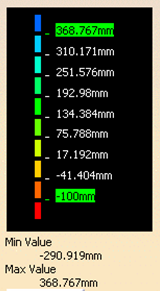
The Surfacic Curvature Analysis.1
dialog box appears and shows the color scale and identifying the maximum
and minimum values for the analysis.
-
You can right-click on a color rectangle in
the color scale to display the contextual menu. The commands available
in this contextual menu are explained below.
-
Edit
contextual command allows you to modify the values in the color range
to highlight specific areas of the selected surface. The Color dialog
box is displayed allowing the user to modify the color range.
-
Unfreeze contextual command
allows you to perform a linear interpolation between non defined
colors.
-
Highlight option allows
you to disable the Highlight faces and edges option in Tools
> Options > General > Display > Navigation which highlight of the geometry selection.
-
Number of Colors
option allows you to
change the number of colors on the scale. You can type the value or
use the arrows to change the value in the Number of Colors
dialog box. The default number of colors available for the color scale
is 10, while you can select a number in a range between 2 to 33.
-
You can also right-click on the value
to display the contextual menu. The commands available in this
contextual menu are explained below.
-
Edit contextual command allows you to modify the edition values.
The
Value Edition dialog box is displayed: enter a new value
(negative values are allowed) to redefine the color scale, or use the
slider to position the distance value within the allowed range, and
click OK.
The value is then frozen, and displayed in a green rectangle.
-
Unfreeze contextual command
allows you to perform a linear interpolation between non defined
values, meaning that between two set (or frozen) colors/values, the
distribution is done progressively and evenly. This command is
available for all values except for maximum and minimum values.
The unfreezed values are no longer highlighted in green.
-
Use
Max / Use Min contextual commands allow you to evenly
distribute the color/value interpolation between the current limit
values, on the top/bottom values respectively, rather than keeping it
within default values that may not correspond to the scale of the
geometry being analyzed. Therefore, these limit values are set at a
given time, and when the geometry is modified after setting them, these
limit values are not dynamically updated.
-
These commands are available for maximum
and minimum values only.
-
The Use Max command is
available if the maximum value is higher or equal to the medium
value, otherwise you need to unfreeze the medium value first.
-
The Use Min command is
available if the minimum value is lower or equal to the medium value,
otherwise you need to unfreeze the medium value first.
-
Use Min Max
button in the Surfacic Curvature Analysis.1 dialog box makes
in one action both Use Max / Use Min contextual
commands operation.
-
Non-linear Ramp
option allows you to
distribute the values based on a range of values resulted from
analysis.
-
If the analysis result includes
both positive and negative values and the Absolute Extrema
option is
selected:
-
The minimum negative value is
displayed at the bottom end and minimum positive value at the top of
the color scale.
-
The values of the flat
curvature are displayed in between both ends of the color
scale.
If analysis result includes both positive and negative values and
the Absolute Extrema
as well as Green is Flat options are
selected, then the number of colors in the color scale is an odd
number.
Notes:
-
This option is available when
an analysis result contains both positive and negative values.
-
The Non-linear Ramp
check box is also available in the Surfacic Curvature Analysis.x
color scale dialog box.
-
Absolute Extrema
option allows you to
display the minimum absolute radius values at the top and bottom of
the color scale.
If the analysis result includes
both positive and negative radius values:
-
The minimum negative radius
value (for sharp curvature) is displayed at the bottom and minimum
positive radius value at the top of the color scale.
-
The maximum absolute radius
values (for flat curvature) are displayed somewhere in between both
ends of the color scale.
-
If the Green is Flat
contextual command is selected, then the green color is assigned to
a radius value of the flat curvature.
If the analysis result includes
only positive or negative values:
-
The minimum radius value is
displayed at the bottom and maximum radius value at the top of color
scale.
-
The Green is Flat contextual
command is unavailable in this case.
Note: The Absolute Extrema check box is also available in
the Surfacic Curvature Analysis.x color scale dialog box.
-
The
Green is Flat
option allows you to set
green color for the radius value of a flat curvature. This option is
available in the below cases:
The Absolute Extrema option is selected.
The number of colors in the color scale is an odd number.
Note: This option is available when the analysis result contains both
positive and negative radius values.
-
Color Scale
Variant: You can save the necessary color scale setting
as a variant and then reuse it.
Click Creates a new variant
and specify name in the Variant Editor
dialog box. This variant name becomes available in the
Color Scale Variant list. You can
modify the current variant or delete it.
|
|
Analysis Types and Display Options
|
|
-
Select the Gaussian analysis type and the
On the Fly option.
-
Click the Use Min Max button in the
Surfacic Curvature Analysis.1 dialog box.
Maximum and minimum values are set according to
the computed values displayed below the color scale.
Move the cursor on the surface.
|
|
|
You can also right-click On the Fly
curvature/radius label to display the contextual commands, see
On the Fly option. |
|
Case of a Ruled Surface
|
| |
-
Select Surface.2
-
Click the Use Min Max button in the
Surfacic Curvature Analysis.1 dialog box.
Values are equal to 0.
-
Move the cursor on the surface.
-
Select Surface.1
-
Select the Minimum analysis type.
-
Click the Use Min Max button in the
Surfacic Curvature Analysis.1 dialog box.
-
Move the cursor on the surface.
Minimum curvature and radius values are
displayed.
|
|
|
The color scale in the Surfacic Curvature
Analysis.1 dialog box corresponds to the previous type analysis
(Gaussian).
The color scale doesn't change when you select another analysis type or
element. This behavior allows you keep a reference when you compare
curvature values. |
|
-
Select the Maximum analysis type.
-
Click the Use Min Max button in the
Surfacic Curvature Analysis.1 dialog box.
-
Move the cursor on the surface.
Maximum curvature and radius values are
displayed.
-
Select the Mean
analysis type.
-
Click the Use Min Max button in the
Surfacic Curvature Analysis.1 dialog box.
-
Move the cursor on the surface.
The computed curvature is
equal to (Minimum curvature + Maximum curvature) / 2. This mean
curvature and radius values are displayed.
-
Select the Limited analysis type.
In the Surfacic curvature dialog box:
-
You are able to modify the limited radius value. The
value is automatically updated in the color scale. You can edit the
limited radius value in the color scale also.
-
The limited radius value is represented as an
intermediate value in the color scale. The elements with a curvature
radius more than the limited radius are displayed in green and the
elements with a curvature radius less than the limited radius are
displayed in blue or red, provided that the default color scale is used.
-
If you enter a limited radius value which is
greater than the max value in the color scale, the max value is updated
to the limited radius value making both the values equal. The same is
applicable for the min value in the color scale.
-
Positive only and Radius mode
options have been disabled.
The Surfacic Curvature Analysis.1
dialog box has been modified: the color scale has been reduced: four colors
and three values.
-
Edit the top color and the maximal and minimal values in
the Surfacic Curvature Analysis.1 dialog box as follow, see
Edit color and
Edit edition values.
Minimum curvature and radius values are
displayed.
-
Select the Inflection Area analysis type.
In the Surfacic curvature dialog box
only the Color Scale and Highlight options are available.
The Surfacic Curvature Analysis.1
dialog box has been modified.

This analysis enables to identify the curvature
orientation:
See also
Creating Inflection Lines.
Note that these inflection lines are always created within the green area,
i.e. when the curvature orientation is changing.
-
Select the Minimum analysis type and the 3D MinMax option.
-
Click the Use Min Max button in the Surfacic Curvature Analysis.1 dialog box.
Maximum and minimum values are displayed and
located on the selected element according to the computed values displayed
below the color scale.
|
| |
Analysis Options
|
|
-
Select the Positive only option and keep
the Radius Mode option cleared.
-
Click the Use Min Max button in the
Surfacic Curvature Analysis.1 dialog box.
Minimum value is set to 0 below the
color scale.
Only positive values are displayed and located
on the selected element. Minimum value is set to 0 below the
color scale.
-
Select the Radius Mode option and clear the
Positive only option.
-
Click the Use Min Max button in the
Surfacic Curvature Analysis.1 dialog box.
-
Edit the minimal value in the Surfacic Curvature
Analysis.1 dialog box as follow, see
Edit edition values.
Maximum and minimum radius values are displayed
and located on the selected element according to the computed values
displayed below the color scale.
-
Select the Gaussian analysis type.
-
Click the Use Min Max button in the
Surfacic Curvature Analysis.1 dialog box.
-
Click OK in the Surfacic curvature
dialog box.
-
Click the Control Points icon:

You can display the control points still viewing
the surfacic curvature analysis. This allows you to check any modification
which affect the surface.
-
Click Cancel in the Control Points
dialog box.
|