You can perform the following modifications to a Gantt chart:
- Hide or show all columns
- Selectively hide or show default columns
- Add or remove non-default columns, i.e., columns representing attributes that can set as properties of a resource or activity. These attributes can be those that are defined for the activity or resource or attributes that users define using Knowledgeware. Also, the operation time of a process is the result of a scientific calculation of time (SCT Duration) that relies on a complex formulae; you can see all the parameters used in the formulae and the calculated result.
-
With the Gantt chart open, right-click on a column heading to display the context menu:
Note: All columns are checked by default; Activity/Resource cannot be hidden. 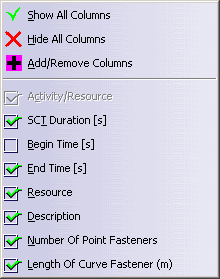
-
Deselect all columns except Begin Time, End Time and SCT Duration.
-
Right-click on the column heading again, and select Add/Remove Columns.
The Add/Remove Columns dialog box appears. 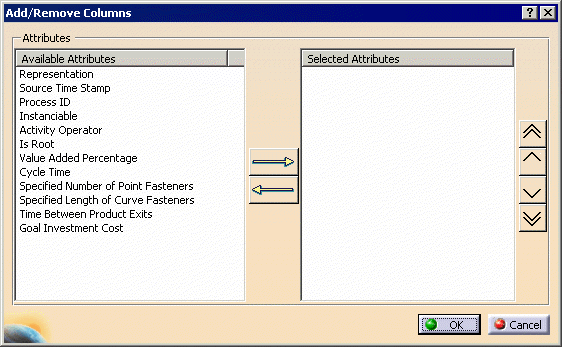
The available attributes may vary depending on any user-defined attributes you have created or the resources and activities you have loaded into the Gantt chart. -
Select one or more attributes, and click the right arrow to move them to the Selected Attributes column.
You can re-order the attributes by using the top, up, down, or bottom arrows. -
Click OK.
The selected columns appear in the Gantt chart in the order specified. To re-display all the columns, right-click again, and select Show All Columns.